Author: investmentinsightssite

BRICS Manufacturing PMI February 2018

canada-manufacturing-777x437


Brazil

Source: Trading Economics

Brazil’s IHS Markit Manufacturing PMI rose to 53.2 in February 2018 from 51.2 in January 2018. This was the seventh consecutive month of improvement in factory activity in Brazil and the strongest in three months. The data shows that New Orders and Output rose at a robust pace and was supported by domestic client demand which helped to offset a moderate fall in exports. Employment grew the most since March 2011 which was a reflection of higher business confidence. Input inflation eased to a four month low and remained overall amid higher prices of raw materials, such as steel. Due to this, manufacturers continued to pass some of their higher input costs to customers with selling prices rising at the fastest pace since June 2016. Brazil’s Manufacturing PMI is reported by Markit Economics.

Russia

Source: Trading Economics

Russia’s IHS Markit Manufacturing PMI dropped to 50.2 in February 2018 from 52.1 in January 2018. The latest reading pointed to the weakest pace of expansion in manufacturing activity since the contraction in July 2016. New orders rose the least in eight months, output advanced at the softest pace since October and buying activity grew marginally. Employment contracted at the fastest rate in nearly a year with backlogs also falling modestly. New export orders expanded the most since November 2011 and business sentiment reached a five-month high. Price pressures remained subdued with charges rising marginally driven by fragile demand conditions. Manufacturing PMI in Russia is reported by Markit Economics.

India

Source:Trading Economics

India’s Nikkei Manufacturing PMI unexpectedly fell to 51.2 in February 2018 from 52.4 in January 2018 missing the market consensus of 52.8. The reading indicated the weakest exapansion in manufacturing sector since October 2017. Output and new export orders increase at softer paces while new orders rose the least in four months. The data also indicates that buying activity went up at the slowest pace since a decline in October 2017. Employment grew slightly more than in a month earlier and business sentiment remained optimistic. On the price front, cost inflation accelerated to the fastest since February 2017. Manufacturers raised their output charges in an attempt to pass through higher cost burdens to clients. Manufacturing PMI in India is reported by Markit Economics.
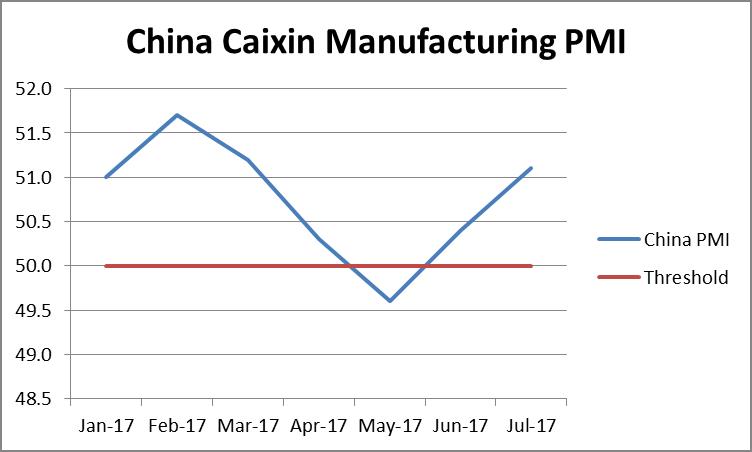
China

Source: Trading Economics

China’s Caixin Manufacturing PMI slightly increased to 51.6 in February 2018 from 51.5 in January 2018 coming in higher than the market consensus of 51.3. This was the highest reading since August 2017 as new orders grew slightly faster. The sentiment hit its highest in 11 months and output continued to rise. Buying activity increased modestly while firms continued to shed staff. Input price inflation eased to the lowest in seven months, but remained much stronger than that of output charges. Manufacturing PMI in China is reported by Markit Economics.

South Africa

Source: Trading Economics

ABSA’s Manufacturing PMI for South Africa rose 50.8 in February 2018 from 49.9 in January 2018. The latest reading pointed to the first expansion in factory activity since May last year. Firms  expect an improvement in manufacturing amid a brighter outlook for the local economy. Manufacturing PMI in South Africa averaged 51.29 from 1999 until 2018. It reached an all time high of 64.20 in July of 2006 and a record low of 34.20 in April 2009.

 A Manufacturing PMI reading above 50 is an indicator of an expanding manufacturing sector while a Manufacturing PMI below 50 is an indicator of a contracting manufacturing sector.


img_0358-1

Brandon Msimanga

Economic and Investment Analyst

BCom Economics, University of Pretoria

BCom (Hons) Business Management, University of Pretoria

Warren Buffet Wins $1 Million Hedge Fund Bet

6-hustles-warren-buffett-used-to-make-53000-by-age-16

Warren Buffett challenged Hedge Funds to a bet 10 years ago. He essentially made a bet that anyone who invested in a passive S&P 500 index fund would get better results than if they had invested in an actively managed portfolio in a hedge fund.

In 2007, Warren Buffett challenged finance professionals in the hedge fund industry to accept a bet that Buffett described in his 2016 letter to shareholders of Berkshire-Hathaway (NYSE:BRK.A) (NYSE:BRK.B) (see p. 21-21):

In Berkshire’s 2005 annual report, I argued that active investment management by professionals – in aggregate – would over a period of years underperform the returns achieved by rank amateurs who simply sat still. I explained that the massive fees levied by a variety of “helpers” would leave their clients – again in aggregate – worse off than if the amateurs simply invested in an unmanaged low-cost index fund.

Subsequently, I publicly offered to wager $500,000 that no investment pro could select a set of at least five hedge funds – wildly-popular and high-fee investing vehicles – that would over an extended period match the performance of an unmanaged S&P-500 index fund charging only token fees. I suggested a ten-year bet and named a low-cost Vanguard S&P fund as my contender. I then sat back and waited expectantly for a parade of fund managers – who could include their own fund as one of the five – to come forth and defend their occupation. After all, these managers urged others to bet billions on their abilities. Why should they fear putting a little of their own money on the line?

Warren Buffett then further goes on:

What followed was the sound of silence. Though there are thousands of professional investment managers who have amassed staggering fortunes by touting their stock-selecting prowess, only one man – Ted Seides – stepped up to my challenge. Ted was a co-manager of Protégé Partners, an asset manager that had raised money from limited partners to form a fund-of-funds – in other words, a fund that invests in multiple hedge funds.

I hadn’t known Ted before our wager, but I like him and admire his willingness to put his money where his mouth was. He has been both straight-forward with me and meticulous in supplying all the data that both he and I have needed to monitor the bet.

For Protégé Partners’ side of our ten-year bet, Ted picked five funds-of-funds whose results were to be averaged and compared against my Vanguard S&P index fund. The five he selected had invested their money in more than 100 hedge funds, which meant that the overall performance of the funds-of-funds would not be distorted by the good or poor results of a single manager.

Each fund-of-funds, of course, operated with a layer of fees that sat above the fees charged by the hedge funds in which it had invested. In this doubling-up arrangement, the larger fees were levied by the underlying hedge funds; each of the fund-of-funds imposed an additional fee for its presumed skills in selecting hedge-fund managers.

Here are the results for the first nine years of the bet – figures leaving no doubt that Girls Inc. of Omaha, the charitable beneficiary I designated to get any bet winnings I earned, will be the organization eagerly opening the mail next January.

Capture

Footnote: Under my agreement with Protégé Partners, the names of these funds-of-funds have never been publicly disclosed. I, however, see their annual audits.

The compounded annual increase to date for the index fund is 7.1%, which is a return that could easily prove typical for the stock market over time. That’s an important fact: A particularly weak nine years for the market over the lifetime of this bet would have probably helped the relative performance of the hedge funds, because many hold large “short” positions. Conversely, nine years of exceptionally high returns from stocks would have provided a tailwind for index funds.

Instead we operated in what I would call a “neutral” environment. In it, the five funds-of-funds delivered, through 2016, an average of only 2.2%, compounded annually. That means $1 million invested in those funds would have gained $220,000. The index fund would meanwhile have gained $854,000.

The current status of the bet:

The Oracle of Omaha once again has proven that Wall Street’s pricey investments are often a lousy deal. Warren Buffett made a $1 million bet at end of 2007 with hedge fund manager Ted Seides of Protégé Partners. Buffett wagered that a low-cost S&P 500 index fund would perform better than a group of Protégé’s hedge funds.

Buffett’s index investment bet is so far ahead that Seides concedes the match, although it doesn’t officially end until Dec. 31.

The problem for Seides is his five funds through the middle of this year have been only able to gain 2.2% a year since 2008, compared with more than 7% a year for the S&P 500 — a huge difference. That means Seides’ $1 million hedge fund investments have only earned $220,000 [through 2016] in the same period that Buffett’s low-fee investment gained $854,000.

“For all intents and purposes, the game is over. I lost,” Seides wrote. The $1 million will go to a Buffett charity, Girls Inc. of Omaha.

In conceding defeat, Seides said the high investor fees charged by hedge funds was a critical factor. Hedge funds tend to be a good deal for the people who run the funds, who pass on big bills to the investors.

“Is running a hedge fund profitable? Yes. Hedge fund managers typically demand management fees of 2 percent of assets under management,” according to Capital Management Services Group (CMSG), which tracks the hedge fund industry. “Performance fees for managers can be 20 percent to 50 percent of trading profits,” CMSG adds.

By contrast, the costs of an average index fund are minimal. A fund that tracks the S&P 500 fund might have an expense ratio of as little as 0.02%.

img_0358-1

Brandon Msimanga

Economic and Investment Analyst

BCom Economics, University of Pretoria

BCom (Hons) Business Management, University of Pretoria

China’s CAIXIN Manufacturing Purchasing Managers Index Improves in July 2017

103675838-GettyImages-457345361.530x298 (1)

image cnbc.com

Chinas Caixin Manufacturing Purchasing Managers Index (PMI) has shown an improvement from June 2017 . The Caixin Manufacturing (PMI) which is a private survey came in at 51.1 which is a three which is an improvement from the June 2017 reading of 50.4.

China PMI July 2017

The Caixin PMI is based on a survey of smaller private companies while the official data is focused on larger, state owned companies. The official data is reported by China’s National Bureau of Statistics (NBS) and the China Federation of Logistics and Purchasing (CFLP). The official manufacturing PMI is reported as 51.4 for July 2017 which is an increase from the June 2017 reading of 51.7.

According to Caixin, subindexes of output and new orders expanded at their fastest pace since February due to an expansion in exports.  PMI Levels above 50 are a signal of expansion while levels below 50 are a signal for contraction.

The expectation among economists is that China’s economy will slow down in the second half of 2017. The government intends to rein in a hot property market and rising corporate debt is expected to start weighing more on business sentiment and corporate activity.

img_0358-1

Brandon Msimanga

BCom Economics, University of Pretoria

BCom (Honours) Business Managment, University of Pretoria


India’s Nikkei Manufacturing PMI Declines in June 2017

13785-manufacturing-reuters.jpg

India’s Nikkei Manufacturing Purchasing Managers Index (PMI) declined to 50.9 in June 2017 from 51.6 in May 2017. It was the weakest growth in factory activity since February 2017. The Nikkei India Manufacturing PMI is a survey of 500 manufacturing companies. Manufacturing PMI in India is reported by Markit Economics.

India Nikkei Manufacturing PMI June 2017

The June 2017 rating was the weakest growth in manufacturing activity since February 2017. Output and new orders expanded at a slower pace while business sentiment softened. The employment and buying levels only went up marginally.

The rate of cost inflation was at its weakest in June 2017 since August 2016 and output charges increased only slightly since the previous month. India’s Manufacturing PMI rating is only slightly above 50 indicating that it is still expanding. A Manufacturing PMI rating below 50 is an indicator of a declining manufacturing sector.

img_0358-1

Brandon Msimanga

Economic and Investment Analyst

BCom Economics, University of Pretoria

BCom (Hons) Business Management, University of Pretoria

Brazil’s Markit Manufacturing PMI Declines in June 2017

             image via Livemint

Brazil’s Manufacturing PMI is reported by Markit. It measures the performance of the manufacturing sector in Brazil and it consists of a survey of 400 industrial companies. Brazil’s Manufacturing PMI rating fell to 50.50 in June 2017 from the previous rating from May 2017 of 52.00. This was below the market consensus of 51.00.

Despite the June 2017 decline Brazil’s Markit Manufacturing PMI showed reflected the third consecutive month of expansion in Brazil’s manufacturing sector. The rating for April 2017 was 50.1, May 2017 was 52.00 which was a multi-year high and June 2017 is reported as 50.50. The manufacturing PMI continued its trend in expansionary territory. A rating of 50 or above is an indicator of expansion while a rating below 50 is an indicator of contraction.


     chart via Trading Economics 

The report by Markit Economics indicates that production and new orders grew at a slower pace while employment continued to contract and buying levels declined. Input price inflation accelerated from May’s 16 month low while output charge inflation softened.


Brandon Msimanga 

Economic and Investment Analyst 

BCom Economics, University of Pretoria 

BCom (Hons) Business Management, University of Pretoria 

China’s CAIXIN Manufacturing Purchasing Managers Index Improves in June 2017


               image via Reuters

Chinas Caixin Manufacturing Purchasing Managers Index (PMI) has shown an improvement from May 2017 and beating expectations. The Caixin Manufacturing (PMI) which is a private survey came in at 50.4 which is a three month high. In May 2017 it was reported at 49.6 which was an 11 month low.

Caixin China Manufacturing PMI

The Caixin PMI is based on a survey of smaller private companies while the official data is focused on larger, state owned companies. The official data is reported by China’s National Bureau of Statistics (NBS) and the China Federation of Logistics and Purchasing (CFLP). The official manufacturing PMI is reported as 51.7 for June 2017 which is an increase from the May 2017 reading of 51.2.

The increase in the PMI was a result of stronger increases in production and new orders which led to companies increasing purchasing activity. PMI Levels above 50 are a signal of expansion while levels below 50 are a signal for contraction.
On the downside from the latest report there is an indication that optimism from business outlook touched its lowest level so far this year.

The Purchasing Managers Index is a good indicator of the health of an economy. It remains to be seen how China’s economy will perform going further into the year.

The United States of America’s (USA) PMI for June 2017 is at 52.00.

Caixin China Manufacturing PMI vs US Manufacturing PMI 


BRICS country’s PMIs for June 2017 are as follows:

• Brazil​​ 50.50

• Russia​​ 50.30

• India​​ 50.90

• South Africa​ 46.70


Brandon Msimanga

Economic and Investment Analyst

BCom Economics, University of Pretoria 

BCom (Hons) Business Management, University of Pretoria 

India Introduces Goods and Services Tax


      image source: livemint.com 

India’s Government has been hard at work in introducing various reforms. The latest of these reforms is the Goods and Services Tax or GST as it is referred to in India. The GST came into effect on the 1st of July 2017. Through the GST India’s Government seeks to simplify its tax system in as far as taxes on Goods and Services in India.

Previously India had nearly a dozen central and state taxes, under GST the tax system will be unified. One of the consequences of the previous tax system was that it resulted in goods moving slowly due to multiple taxes. The movement of goods will be seamless and at a lower cost. The implications are positive from a value chain and consumer perspective. Double taxation was also another consequence under the previous tax regime. Under GST there will no longer be tax on tax on any purchases. From a fiscal stand point it is expected that GST will contribute a 2% points boost in GDP.

 A total of 1211 goods and services have been categorized into varying tax slabs in which they carry a tax rate of 0% (no tax), 5%, 12%,18% or 28%.

0% (No Tax)

Some of the goods that will carry no tax include the following:

  • Fresh meat
  • Eggs
  • Milk
  • Bread
  • Salt
  • Fresh fruits and vegetables
  • Flour

Hotel and lodge services with a tariff below Rs 1,000 ($15.42) will carry no tax.

5% Tax

Some of the goods that will carry a 5% tax include the following:

  • Apparel below Rs 1000 ($15.42)
  • Footwear below Rs 500 ($7.71)
  • Cream
  • Frozen vegetables
  • Coffee
  • Tea
  • Spices
  • Pizza bread
  • Rusks

Transport services (railways, air transport) will carry a 5% tax.

12% Tax

Some of the goods that will carry a 12% tax include the following:

  • Apparel above Rs 1,000 ($15.42)
  • Frozen meat
  • Butter
  • Cheese
  • Fruit juices
  • Umbrellas
  • Sewing machines
  • Cellphones
  • Ketchup & Sauces

Services such as State-run lotteries, Non-AC hotels and business class air tickets will carry a 12% tax.
18% Tax

Some of the goods that will carry an 18% tax include the following:

  • Footwear costing more than Rs 500
  • Software
  • Biscuits
  • Pasta
  • Cornflakes
  • Jams
  • Soups
  • Ice cream
  • Tissues

Services such has AC hotels that serve liquor, telecom services, IT services, branded garments and financial services will carry an 18% tax. Hotels and lodges with tariffs of Rs 2,500 ($38.55) to Rs 7,000 ($107.94).

28% Tax

Some of the goods that will carry a 28% tax include the following:

  • Chewing gum
  • Molasses
  • Paint
  • Deodorants
  • Shaving creams
  • After shave
  • Hair shampoo
  • Dye
  • Sunscreen
  • Dishwasher
  • Washing machine

Services such as Private-run lotteries authorised by states, hotels with room tariffs above Rs 7,500 ($115.65) and cinemas will carry a 28% tax.

*exchange rate conversions are at the time of publishing this article.


Brandon Msimanga 

Economic and Investment Analyst

BCom Economics, University of Pretoria 

BCom (Hons) Business Management, University of Pretoria 

The Superinvestors of Graham and Doddsville

great-value-investors

image source ValueWalk

The Superinvestors of Graham and Doddsville is an article that Warren Buffett wrote in 1984 for the 50th Anniversary of Security Analysis a book that was co-authored by Benjamin Graham and David Dodd in 1934. Benjamin Graham and David Dodd were professors at Columbia Business School who wrote Security Analysis after the massive losses that were incurred during the wall street crash and during the great depression.

Benjamin Graham became Warren Buffett’s teacher and a great influence on his investment strategy. He later wrote the book the Intelligent Investor in 1949. The premise of The Superinvestors of Graham and Doddsville is to challenge the notion that markets are efficient meaning that stock prices reflect everything that is known in the market. If this is the case then it should not be possible to find companies that are undervalued. The other notion that Warren Buffett also challenged in the article is was that investors that were consistently beating the market were just lucky.

Warren Buffett makes an analogy of Orangutans in a coin flipping contest that has several round of elimination that ends with 40 orangutans that consistently won their coin tosses to become the winners. You could easily dismiss it as a random event that could have resulted in any of the Orangutangs that were in the competition making it into the final 40 until you learn that all 40 winners came from the same zoo in Omaha. You would then take an interest into why they outperformed the others could it be their diet or some special exercises they do?

This is the case with the Superinvestors of Graham and Doddsville who each subscribe to the teachings and wisdom of Graham and Dodd resulting in them beating the S&P 500 consistently and becoming very wealthy.

The common intellectual theme of the investors of Graham and Doddsville is this: they search for the discrepancies between the value of a business and the price of small pieces of that business in the market. Essentially, they exploit those discrepancies without the Efficient Market Theorists concern as to whether these stocks are bought on Monday or Thursday, or whether it is January or July, etc.

Among the Superinvestors of Graham and Doddsville, Warren Buffet names the likes of:

  • Walter Schloss of WJS Partnership
  • Tom Knapp and Ed Anderson of Tweedy, Browne Inc
  • Bill Ruane of Sequoia Fund
  • Charlie Munger who became his dear friend and partner at Berkshire Hathaway,
  • Rick Guerin of Pacific Partners,
  • Stan Perlmeter of Perlmeter Partners Ltd

Our Graham & Dodd Investors, needless to say, do not discuss beta, the capital asset pricing model or covariance in returns among securities. These are not subjects of any interest to them. In fact most of them would have difficulty defining those terms. These investors simply focus on two variables: price and value.

The following were their tack records with audited financials at the time

  1. WJS Partnership from 1956-1984 1st Qtr, 28 ¼ year annual compounded rate 21.3% vs Standard & Poors 28 ¼ annual compounded rate 8.4%.
  2. Tweedy, Browne Inc from 1968-1983 15 ¾ year annual compounded rate 20% vs Standard and Poors 7.0%.
  3. Buffet Partnership from 1957-1969, annual compounded rate 29.5% vs Dow 7.4%
  4. Sequoia Fund, Inc from 1970 -1984, annual compounded rate 18% vs Standard and Poors 10%.
  5. Charles Munger (Overall Partnership) from 1962-1975, annual compounded rate 19% vs Dow 5%.
  6. Pacific Partners (Overall Partnership) from 1965-1983, annual compounded rate 32.9% vs 7.8%.
  7. Perlmeter Investments (Overall Partnership) from 1965-1983, annual compounded rate 23% vs Dow 7%.

05062017-Gain-equitymaster

image source equitymaster

The idea here is to buy $1 bills for 40 cents as Warrant Buffet constantly states. You can get the full article here.

img_0358

Brandon Msimanga

Economic and Investment Analyst

BCom Economics, University of Pretoria

BCom (Hons) Business Management, University of Pretoria

South Africa’s Economy Slips into a Recession

rands

The technical definition of a recession is two consecutive quarters of negative growth (real GDP quarter-on-quarter).

gdp_fig1_2017

According to the latest report from Statistics South Africa (STATSSA) the economy contracted by 0.3% in Q4 of 2016 and by 0.7% in Q1 of 2017. The last recession experienced in South Africa was in 2008-2009 due to the global financial crisis, lasting over three quarters.

South Africa recorded negative growth rates in both the secondary and tertiary sectors. The largest declines were recorded in the Manufacturing and Trade Industry which declined by 3.7% and 5.9%. On the other hand the largest growth rates were recorded in the agriculture and mining industries. The agriculture industry grew by 22.2% and the mining industry grew by 12.8% in Q1 of 2017 compared to Q4 of 2016.

gdp_fig3_2017.png

The Primary Sector grew 14.9%, the Secondary Sector declined by 3.4% while Tertiary Sector declined by 2.0%. The Tertiary Sector which consists of finance, transport, trade, government and personal services declined for the first time since the recession in 2009. Agriculture which is in the Primary Sector has shown growth for the first time since Q4 of 2014. The increase in production in field crops and horticultural products lifted the industry in the first quarter. The growth in mining was mainly a result of a rise in production of gold and other metal ores, including platinum.

What are the Implications?

Recessions have various implications depending on their depth and length. The current recession has less depth than the 2008-2009 recession which was a result of the global financial crisis however it may lead to the following:

Unemployment

A fall in GDP may cause a rise in unemployment mainly because as some firms go bankrupt workers lose their jobs. The remaining may have to reduce costs by cutting back on hiring new workers. Most of the time young people are the most affected by unemployment.

Lower Wages

When firms are faced with lower revenues they respond by cutting costs.  This is done by reducing wage expenses which affect temporary workers without permanent contracts the most. In other instances you have scenarios of underemployment whereby workers keep their jobs but rather than working full time they only work part time i.e working 20 hours a week.

Decreased Revenues from Taxation

In times of recession the South African Government is faced with decreased revenues from taxation. When firms generate lower profits then it results in the South African Government collecting lower corporate tax. South African workers also receive lower incomes which results in the government receiving lower tax. Consumer expenditure will also decrease resulting in decreased collections in the form of VAT.

Increased Government Expenditure

The South African government may be faced with increased expenditure on welfare payments, unemployment support benefits and income support.

Budget Deficit

As Tax Revenues fall in South Africa while welfare payments increase the result can be a budget deficit and total government debt.


img_0358Brandon Msimanga

Economic and Investment Analyst

BCom Economics, University of Pretoria

BCom (Hons) Business Management, University of Pretoria


Valeant Pharmaceuticals:A Case Study on Corporate Misconduct 


The Background

Valeant Pharmaceuticals (VRX) is a Pharmaceutical Company based in Laval, Quebec, Canada. It develops, manufactures, markets and sells a wide range of pharmaceutical products. Under the leadership of its former CEO J. Michael Pearson the company employed an aggressive strategy to grow through acquisitions. Valeant Pharmaceuticals acquired other pharmaceuticals in order to avoid the costs and the time involved in the Research and Development of new drugs. At a point in 2015 Valeant Pharmaceuticals was the most valuable company in Canada.

What Went Wrong?

“Hindsight is always 20/20” the old adage in life, business and investing rings true. Valeant undertook an aggressive acquisition strategy that was financed by taking on large amounts of debt and aggressively increasing the prices of drugs once a target had been acquired. Valeant raised the price of Cuprimine and Syprine from a price of around $500 to around $24,000 for a 30 day supply. Cuprimine and Syprine are used for treating Wilson disease which is a rare genetic inability to process copper. Valeant also raised the price of Nitropress and Isuprel from around $2000 to $8,000 and $17,900 repectively. Nitropress and Isuprel are two hospital drugs that used in life saving cardiac cases. The kind of behaviour displayed by Valeant is what many would consider to be price gouging.

Valeant’s Business Model involved acquiring drugs that have been around for decades and are off-patent and then dramatically raising prices after the deal has been finalised.

  • Ensuring the company was the sole source of a particular drug;
  • Making the particular drug the gold standard in the industry;
  • Entering a small market or a market for rare diseases;
  • Selling the drug(s) through a closed distribution system, keeping generics from obtaining the drug and creating barriers to entry;
  • Increasing the price to whatever the market would bear.

In Q3 of 2016 Valeant generated cash flow from operations of $569 million. It however suffered an outflow from working capital of $58 million. This could signal that the company is having problems collecting receivables and inventory. On the other hand 2017 is expected to be a down year for Valeant, particularly the U.S Diversified group which will lose exclusivity for certain products and face generic competition. The company’s earnings and cash flow from operations will likely be down.

The current CEO of Valeant, Joe Papa has indicated that not only will Valeant not reduce the price of drugs but that they have no intention to. This does not help the case of Valeant which has faced significant reputational damage and is currently under investigation by the U.S. Securities and Exchange Commission (SEC) and U.S. Attorney’s Offices for Southern District of New York. Bill Ackman’s Pershing Square fund held a major stake in the company before selling out in March 2017 for a reported loss of $2.8 billion. Valeant’s stock plummeted by 90% amidst all the chaos.

When asked about Valeant at the Berkshire Hathaway annual meeting in 2016 Warren Buffett and his partner Charlie Munger had the following to say:

“In my view, the Business Model of Valeant is enormously flawed”-Warren Buffett

“Valeant, of course, was a sewer,” said Munger, adding that the directors deserve “all the opprobrium they are getting.”

Some people have gone as far as comparing the Valeant debacle to WorldCom and Enron.

Brandon Msimanga 

Economic and Investment Analyst

BCom Economics, University of Pretoria 

BCom (Hons) Business Management, University of Pretoria 

+27623987903/+27812592174